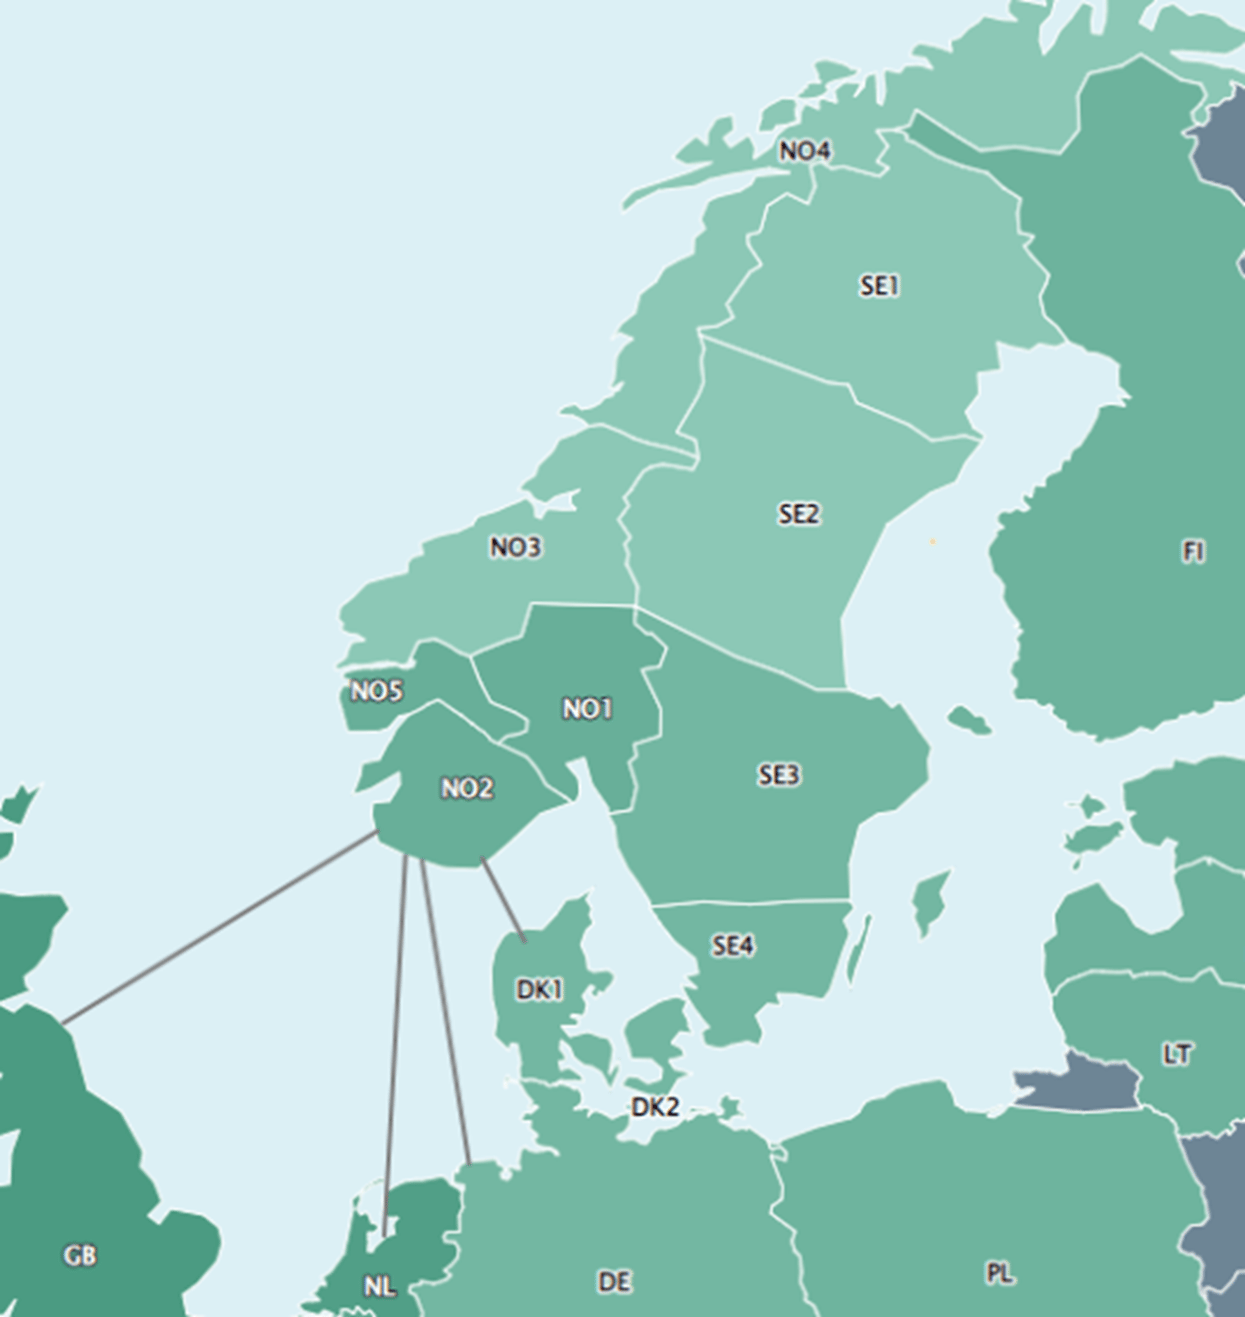
The electricity market is divided into bidding zones. Norway has five bidding zones, while Sweden has four and Denmark has two. The electricity price per price bidding zone is determined on the power exchange (NordPool) for each hour of the day based on supply and demand.
What are congestion revenues?
Congestion revenues arise when power is transferred between bidding zones with different electricity prices. Congestion revenues that arise from power exchange with other countries, i.e., on interconnectors, are shared 50/50 between Statnett and the partner in the neighboring country.
Revenues that arise from power exchange between bidding zones in Norway accrue entirely to Statnett. Since Statnett’s allowed income is regulated, these congestion revenues are passed on to our customers through a reduction in tariffs.
In the table, you will find an overview of received congestion revenues for 2026 per month. The amounts are given in millions of euros and are updated on the 10th of the following month.
Congestion revenues 2026 - mill. EUR - per country
| Month | Norway internally | NO-SE | NO-FI | NO-DK (Skag-erak 1-4) | NO - NL (Nor Ned) | NO-DE (Nord-Link) | NO-UK (NSL) | Sum | Acc. to date 2024 |
| January | 29,3 | 8,3 | 0,6 | 2,6 | 0,6 | 2,8 | 2,5 | 46,7 | 46,7 |
| February | 38,0 | 6,7 | 0,6 | 1,8 | 1,2 | 2,4 | 2,6 | 53,2 | 99,9 |
| March | 31,9 | 29,0 | 0,1 | 10,9 | 3,3 | 10,7 | 7,7 | 93,7 | 193,6 |
| April | 25,2 | 25,1 | 0,2 | 7,1 | 3,3 | 11,7 | 8,6 | 81,3 | 274,9 |
| May | 35,0 | 13,6 | 0,2 | 6,7 | 1,9 | 8,6 | 9,5 | 75,6 | 350,5 |
| June | |||||||||
| July | |||||||||
| August | |||||||||
| September | |||||||||
| October | |||||||||
| November | |||||||||
| December | |||||||||
| Sum | 159,4 | 82,7 | 1,8 | 29,1 | 10,3 | 36,4 | 31,0 | 350,5 | N/A |
Congestion revenues 2026 - NO-internally - mill.EUR - per connection
| Month | Norway internally | NO1-NO2 | NO1-NO3 | NO1-NO5 | NO2-NO5 | NO3-NO4 | NO3-NO5 |
| January | 29,3 | 8,4 | 1,1 | 6,5 | 0,7 | 10,5 | 1,9 |
| February | 38,0 | 21,1 | 0,8 | 5,8 | 1,6 | 6,6 | 2,0 |
| March | 31,9 | 2,9 | 1,3 | 4,5 | 1,5 | 11,7 | 10,0 |
| April | 25,2 | 7,1 | 2,4 | 4,5 | 1,6 | 3,7 | 5,9 |
| May | 35,0 | 2,8 | 2,1 | 5,7 | 2,5 | 16,3 | 5,6 |
| June | |||||||
| July | |||||||
| August | |||||||
| September | |||||||
| October | |||||||
| November | |||||||
| December | |||||||
| Sum | 159,4 | 42,4 | 7,7 | 27,0 | 7,9 | 48,9 | 25,4 |
Congestion revenues 2026 towards SE - mill.EUR - per connection
| Month | NO-SE | NO1-SE3 | NO3-SE2 | NO4-SE1 | NO4-SE2 |
| January | 8,3 | 3,7 | 2,1 | 2,1 | 0,3 |
| February | 6,7 | 2,8 | 2,7 | 1,0 | 0,2 |
| March | 29,0 | 19,3 | 8,2 | 1,1 | 0,3 |
| April | 25,1 | 14,2 | 9,0 | 1,5 | 0,4 |
| May | 13,6 | 8,8 | 2,7 | 1,6 | 0,4 |
| June | |||||
| July | |||||
| August | |||||
| September | |||||
| October | |||||
| November | |||||
| December | |||||
| Sum | 82,7 | 49,0 | 24,7 | 7,4 | 1,7 |